
I have been looking for a Profiler that works with Delphi and C++ Builder's new compiler, ModernX.
What is Super Luminal?
Superluminal is a modern cutting-edge profiler, for Delphi's 64-bit and C++ Builder's ModernX 64-bit compiler. It is priced affordably, and one-time purchase if you are buying an individual license.
- Individuals: €59 (perpetual license),
- Businesses: €289 (per seat/per year).
Great feature set, and burn-down chart.
Superluminal Tutorial for Delphi
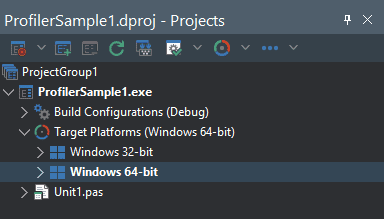
Superluminal is designed to profile 64-bit EXE files. If you are targeting Delphi 32-bit or C++ Builder 32-bit EXEs, you can easily switch your target platform to Delphi or C++ Builder Windows 64-bit.
Step 1. Map2PDB
Superluminal uses PDB files for profiling. However, Delphi generates TDS files. To bridge this gap, you can use a utility called map2pdb that converts MAP files into PDB format.
1. Download `map2pdb.exe` from Anders Melander's Github repository.
2. Copy `map2pdb.exe` to a folder included in your system's environment pat
The below paths are suggested directory for specific Delphi versions.
For Delphi 12.2, Delphi 12.3
C:>Users>Public>Documents>Embarcadero>Studio>23.0>Bpl
For Delphi 12.1:
C:>Users>Public>Documents>Embarcadero>Studio>22.0>Bpl
For Delphi 12.0:
C:>Users>Public>Documents>Embarcadero>Studio>21.0>Bpl
For Delphi 11.3:
C:>Users>Public>Documents>Embarcadero>Studio>20.0>Bpl
_Replace > to "" as Wordpress removes "backslash"._
Note: a Gist version of the above-mentioned paths is provided.
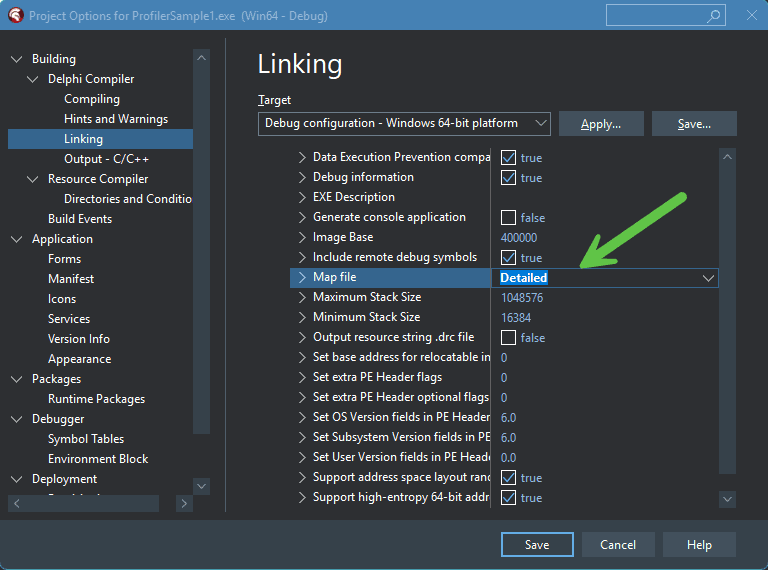
Step 2. Enable Map file output
You need to enable MAP file in Delphi and C++ Builder. By default, this is turned off.
Go to Project | Options, Building | Delphi Compiler | Linking, Map File. Change to Detailed.
For the next step, there are 2 approaches, to generate the MAP file via post-build event, or batch file.
Step 3A. Use Post-build event.
map2pdb.exe -pdb:(OUTPUTDIR)(OUTPUTFILENAME).pdb -bind:(OUTPUTDIR)(OUTPUTFILENAME) (OUTPUTDIR)(OUTPUTNAME).map
Note: a Gist version of the above-mentioned paths is provided.
Step 3B. Use a batch file
map2pdb.exe -pdb:.win64DebugProfilerSample1.pdb -bind:.win64DebugProfilerSample1.exe .win64DebugProfilerSample1.map
pause
where: _win64DebugProfilerSample1.exe_ is your output project.
Note: a Gist version of the above-mentioned paths is provided.
Step 4. Profile!
Please see the github directory for 3 sample projects - in Delphi, C++ Builder and C++ Builder ModernX.
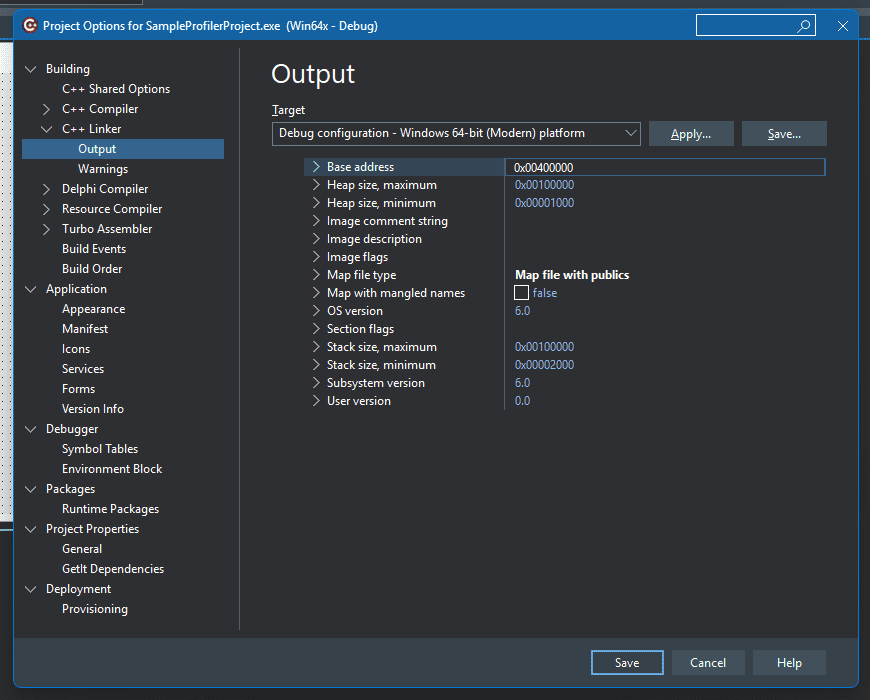
How to get your C++ ModernX project to work with Superluminal
Enable MAP file and set property to Detailed.
Profile! You should be able to see C++ Builder functions in Superluminal.
Alternate Profilers
To profile 32-bit EXEs, you can use Nexus Quality Suite, ProDelphi, Intel VTune, or Spider Profiler.
Enhance your App Performance using NQS
NexusDB's Nexus Quality Suite "NQS" is another excellent choice.
- -NQS includes CodeWatch, TestDriver and Coverage Analyst, invaluable tools to have in your toolchest.
- CodeWatch allows you to check memory-leaks, resource-leaks and API errors.
- TestDriver is a testing tool that records mouse and keyboard-strokes as scripts. TestDriver works with VCL and FMX.
- Coverage Analyst allows you to do code-coverage, to analyze which lines of code the profiler has hit. This allows you to check for redundant, dead-code, or create test-cases with conditions which execute all the lines in the resultant EXE or DLL.
Propel your Delphi app to new heights using ProDelphi
If you are using the Delphi part of RadStudio, ProDelphi is a CPU-cycles profiler. This works by isolating the code profiled, to only specific procedures and functions.
This works by isolating the code profiled, to only specific procedures and functions.
ProDelphi offers an alternative to traditional profiling, where it may be impractical to do whole-app profiling, due to copy-protection code interfering with the Profiler, or contains non-source DCUs or OBJ files, or interfaces third-party DLLs or non-Delphi DLLs which contains copy-protection
ProDelphi allows you to do drill-down profiling, where only certain parts of the application are profiled.
There is no correct way of doing profiling. Profiling is a process of sleuthing, finding bottlenecks and optimizing code.
Are you interested to get competitive priced updates, or need to update your Delphi apps?
Contact us.
Article Corrections
1. Anders Bitbucket link updated to Github.
2. A Gist of the command-line statements are published on Gist. For some reason Wordpress keeps munching the slash for no reason.